ML model to predict patient with heart disease
using the RandomForest, Linear SVC classifier.
Data Source: Kaggle
Libraries and Packages: Scikit-learn, Python-Numpy, Pandas
Keywords:
AUC: Area Under the Curve
Fpr-False Positive rate
Tpr-True Positive rate
Outline
Understanding the objective
Methodology
1. Data Setup
2. Data Cleaning
3. Creating a feature matrix
4. Choosing the right model and hyperparameters
5. Model Evaluation
6. Saving and Loading
7. Summary of Results
Objective
The objective of this project is to provide a technology to determine the prices of new cars that is being produced. Employing the use of predictions models will help to set the most accurate prices for cars based on market value. thereby leading to better growth and outcomes for manufacturers. Features1.Data Setup
- Pip installing the dependencies.
- Importing the dataset and required libraries
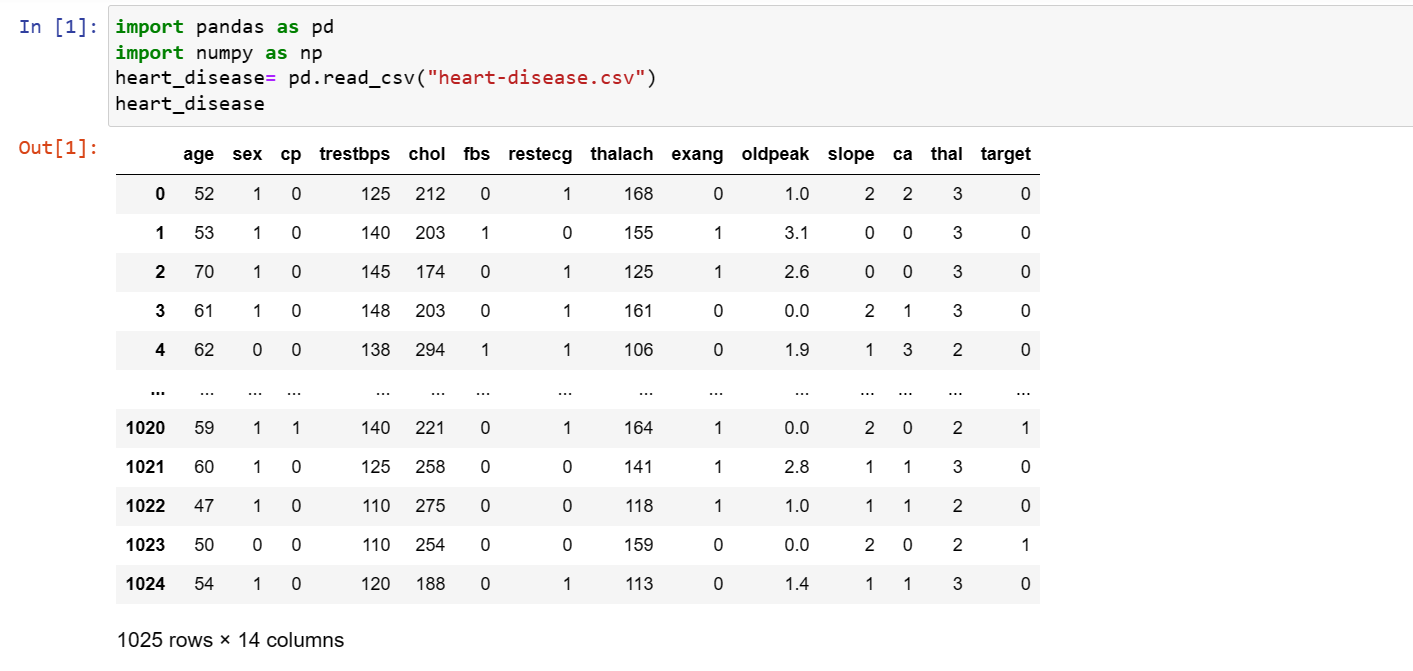
2. Data Cleaning
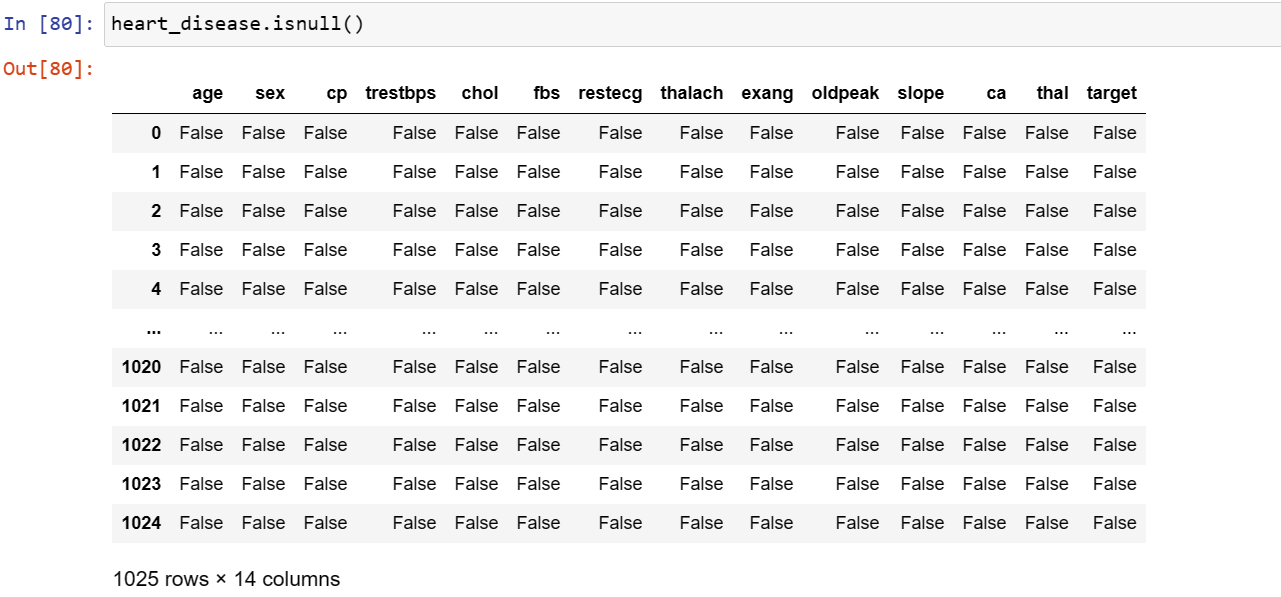
The data was inspected for null values to remove abnormality. However, the dataset showed no missing values.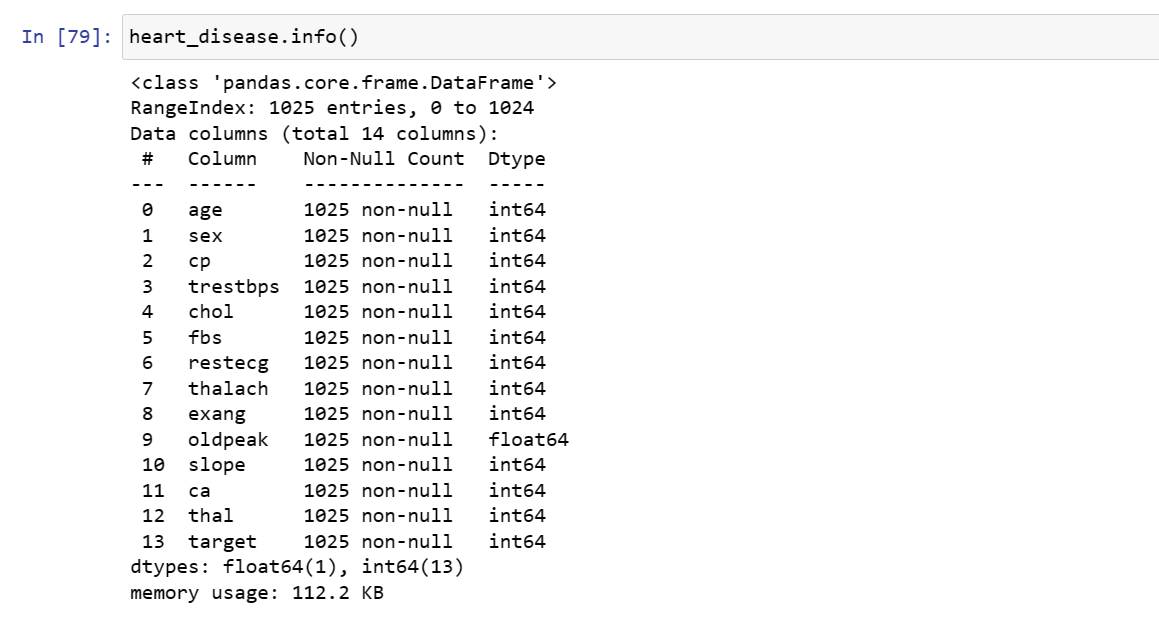
3. Creating a feature matrix
Data was split into x and y to separate features to be trained from the target .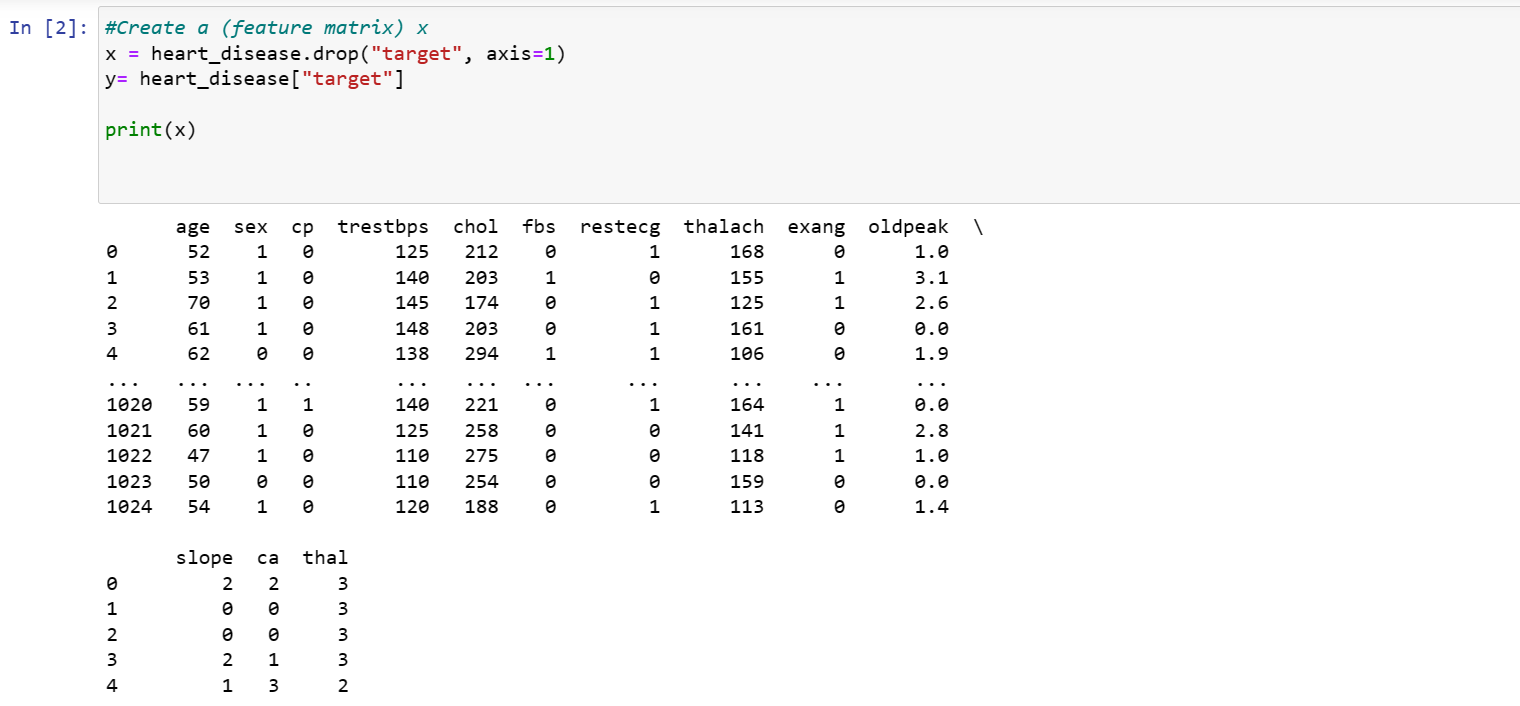
4. Choosing the right model and hyperparameters
Checklink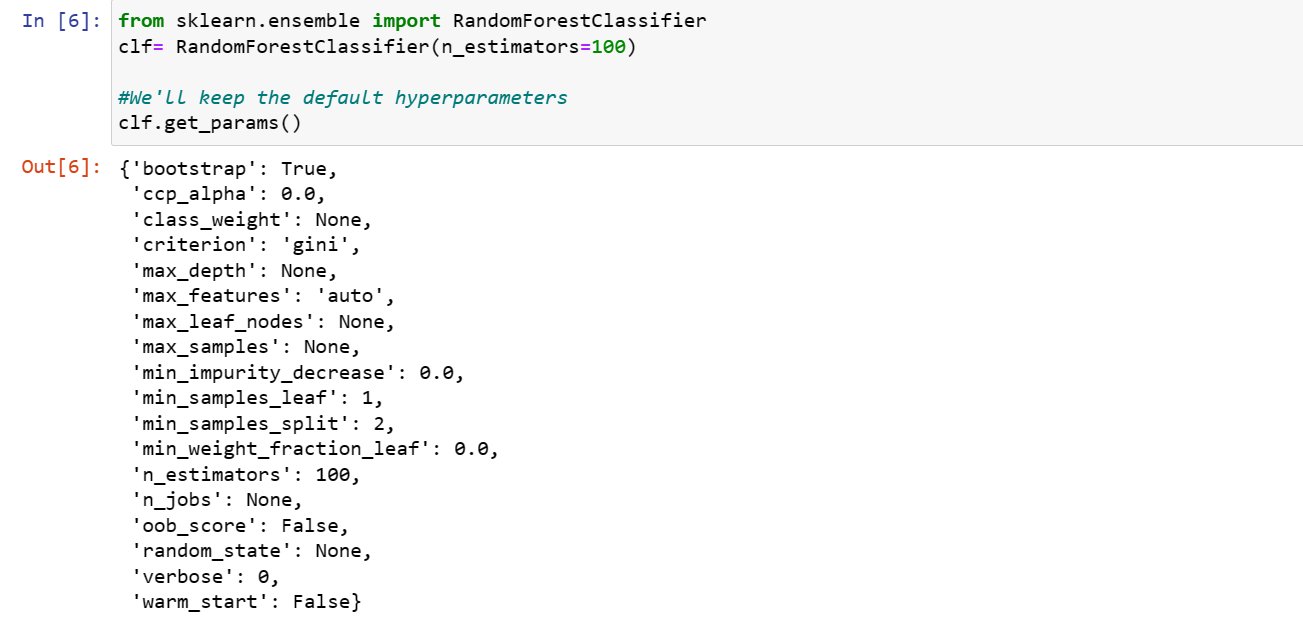
Model Fitting
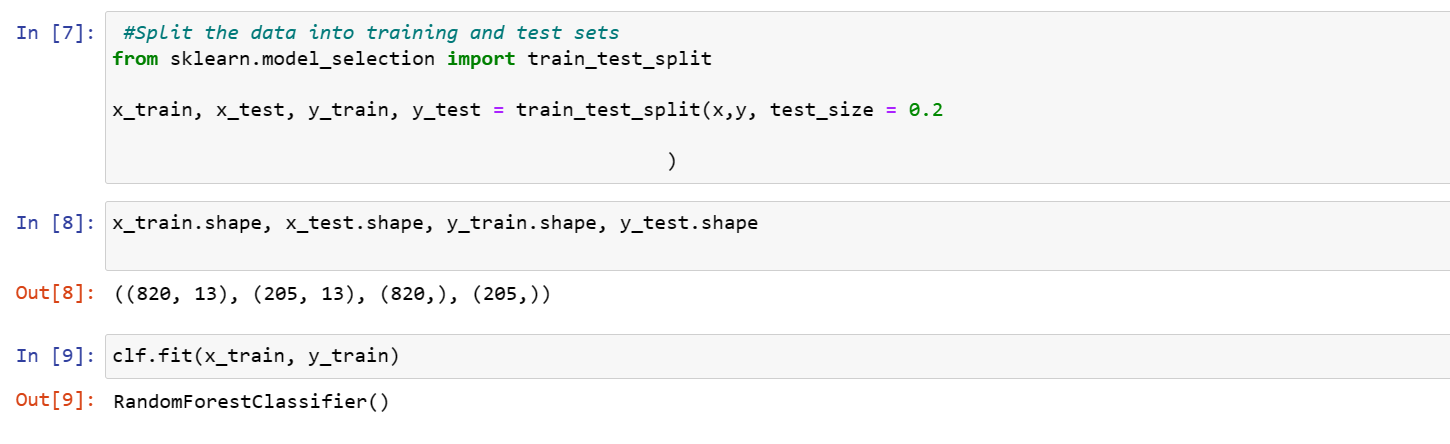 The Random Forest classifier and Linear SVC was chosen as an estimator as prescribed by the scikit learn sheet in the documentation above. The x data was split into training and testing,the data used in training is about 20% indicated by test_size=0.2.The shape of the model was examined and the model fit into train-data.
RandomForest Classifier
The Random Forest classifier and Linear SVC was chosen as an estimator as prescribed by the scikit learn sheet in the documentation above. The x data was split into training and testing,the data used in training is about 20% indicated by test_size=0.2.The shape of the model was examined and the model fit into train-data.
RandomForest Classifier
5. Model Evaluation
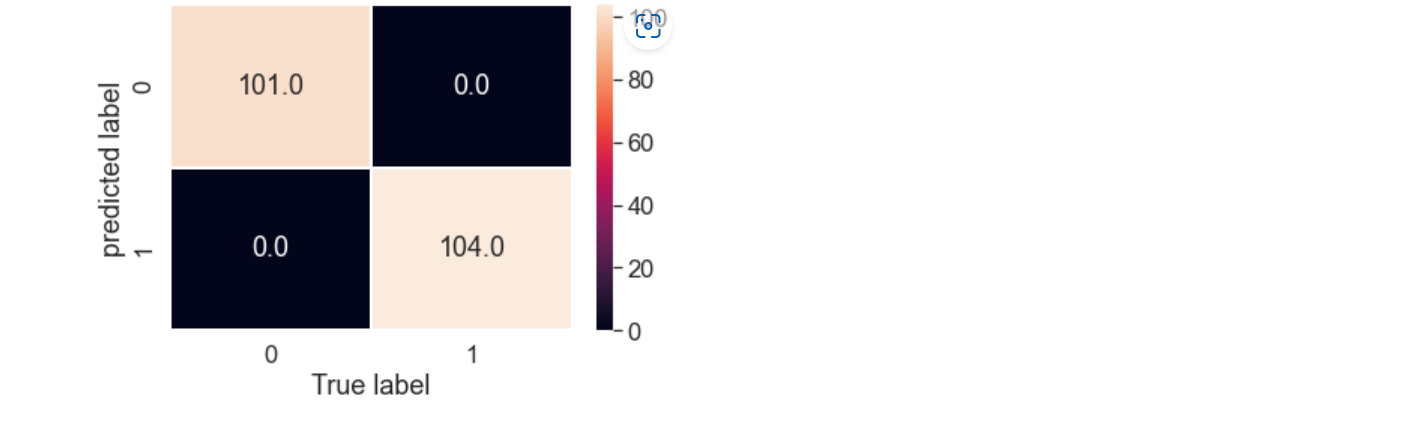
The confusion matrix and scoring parameters were adopted in evaluating this model. The classification result shows an 100% indicating the RandomForest model is a perfect one.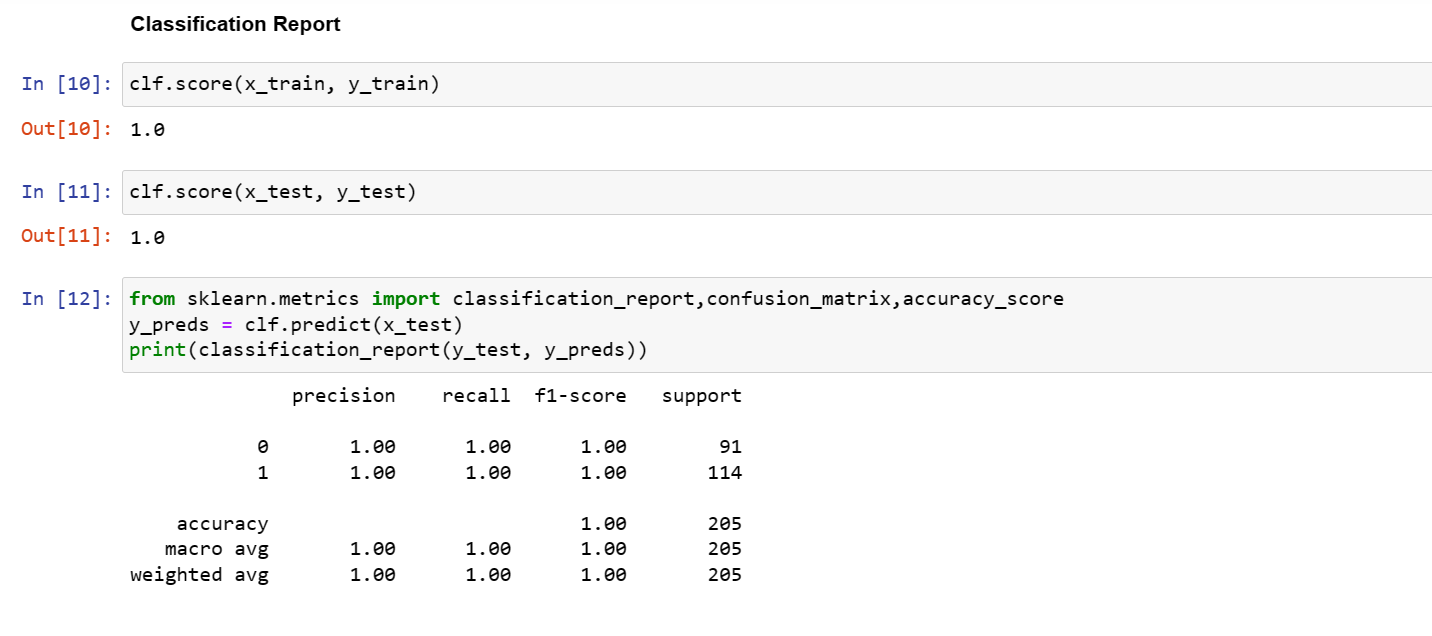
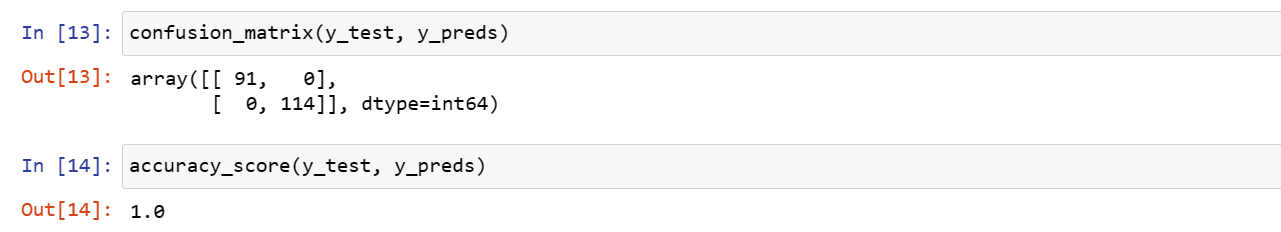 The Confusion matrix summary shows the same result with the classification report showing that the classification is accurate.
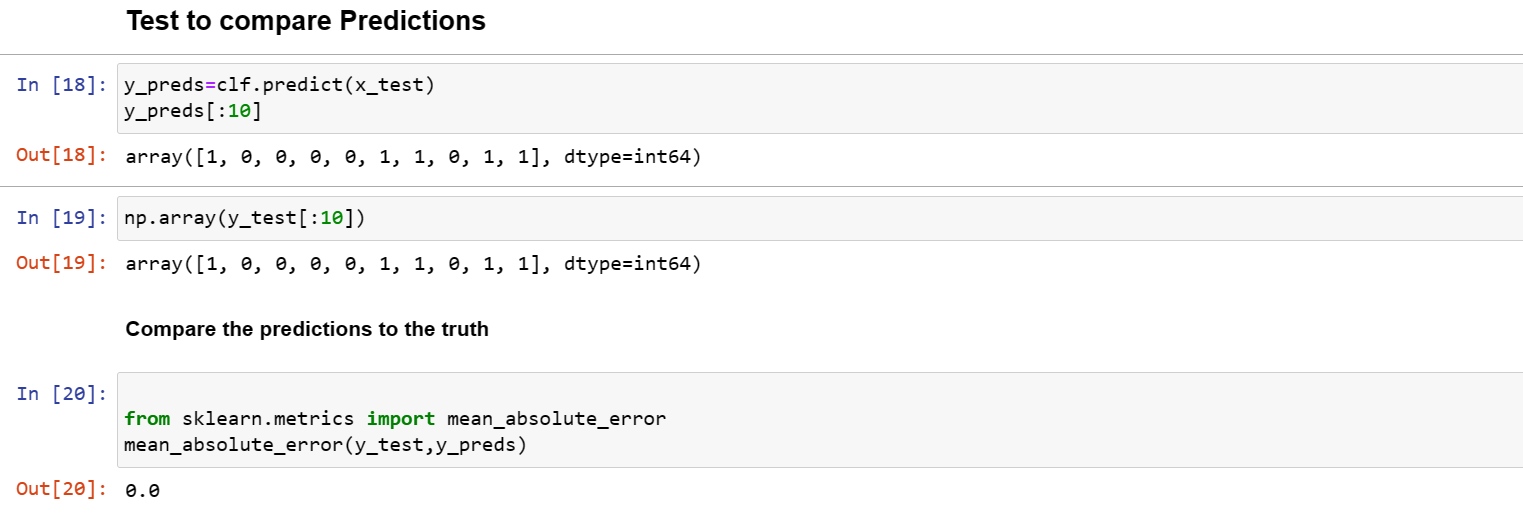 The mean absolute error for the predicted value or its likely deviation from the original value is 0.0.. which is perfect.
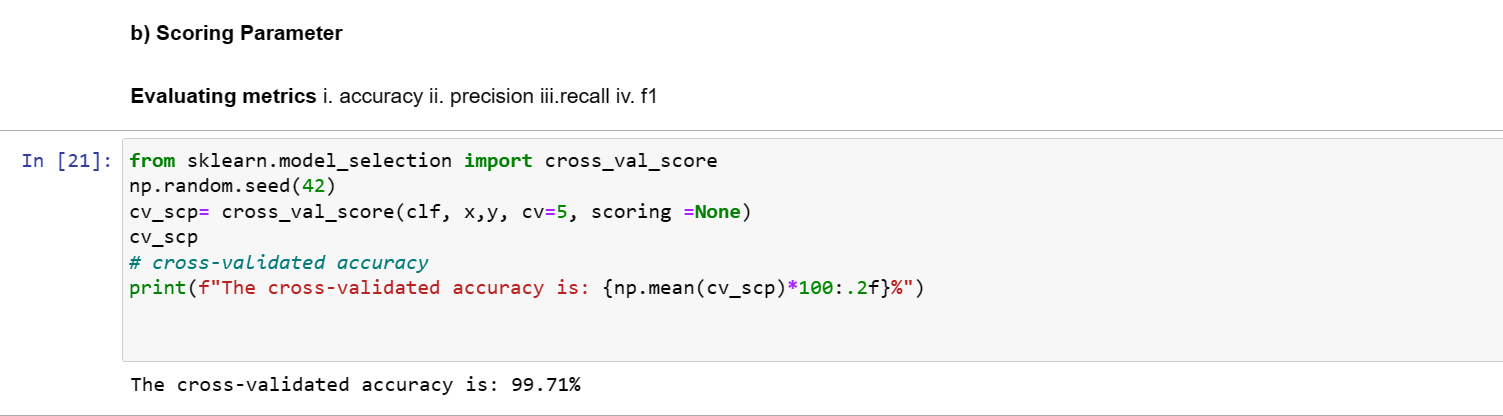
Scoring Parameters
The mean absolute error for the predicted value or its likely deviation from the original value is 0.0.. which is perfect.
Scoring Parameters
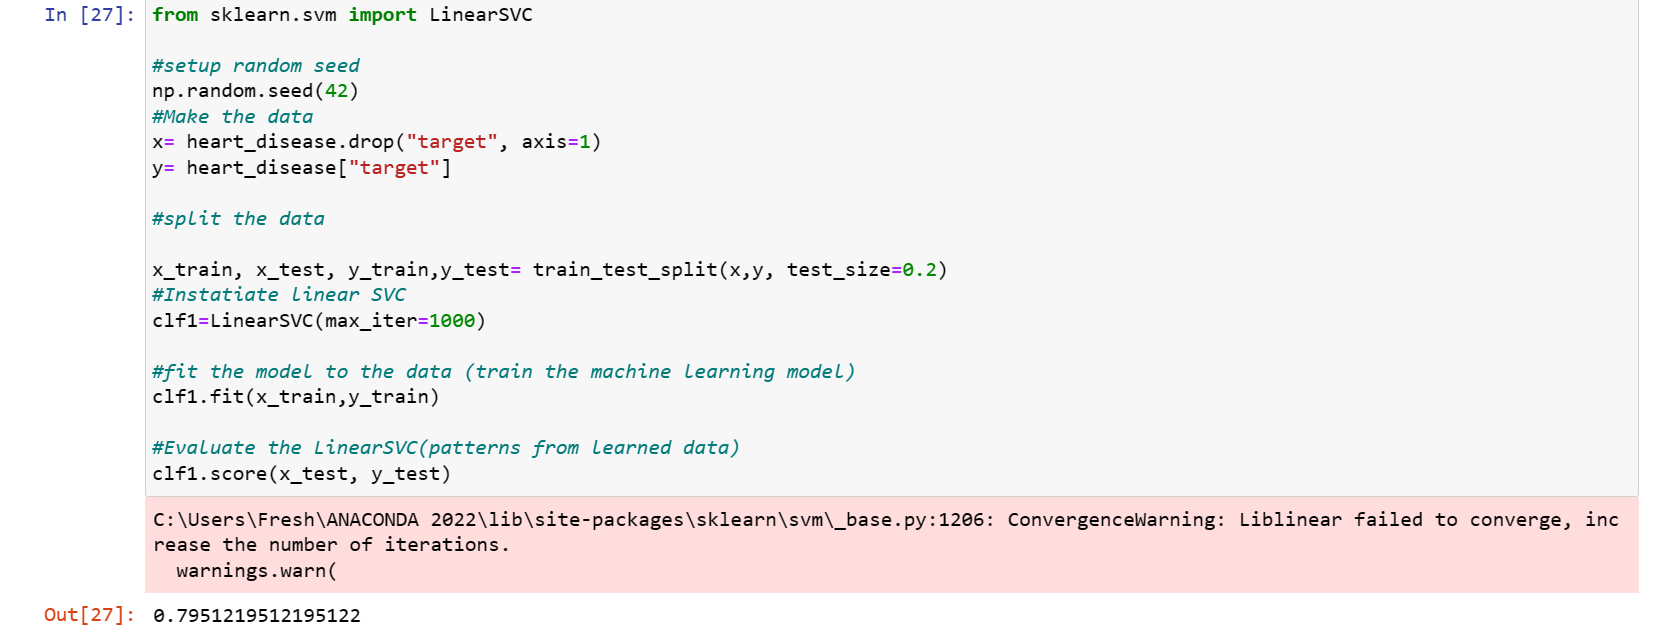
 Linear SVC
The LinearSVC gave a score of 79.5%. This means about 80% of the data should be accurate
Linear SVC
The LinearSVC gave a score of 79.5%. This means about 80% of the data should be accurate
 Evaluating the Linear SVC model
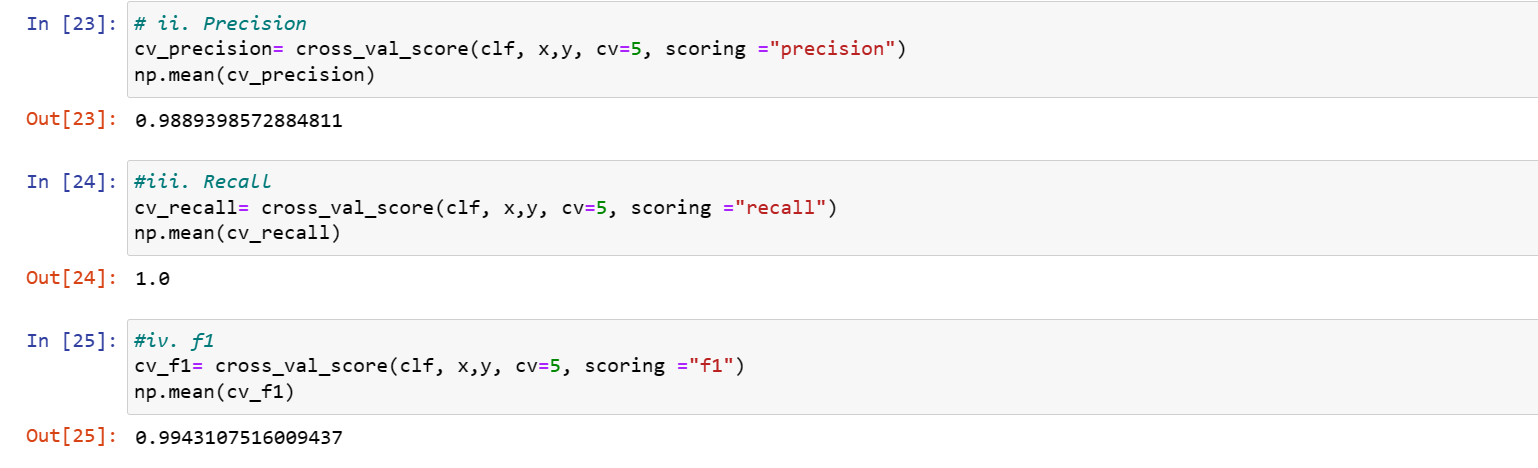
Evaluation Metrics
Score Parameters: 'accuracy', 'average precision', 'recall', 'f1'
Metric functions AUC/ROC score , ' Confusion matrix, Classification report
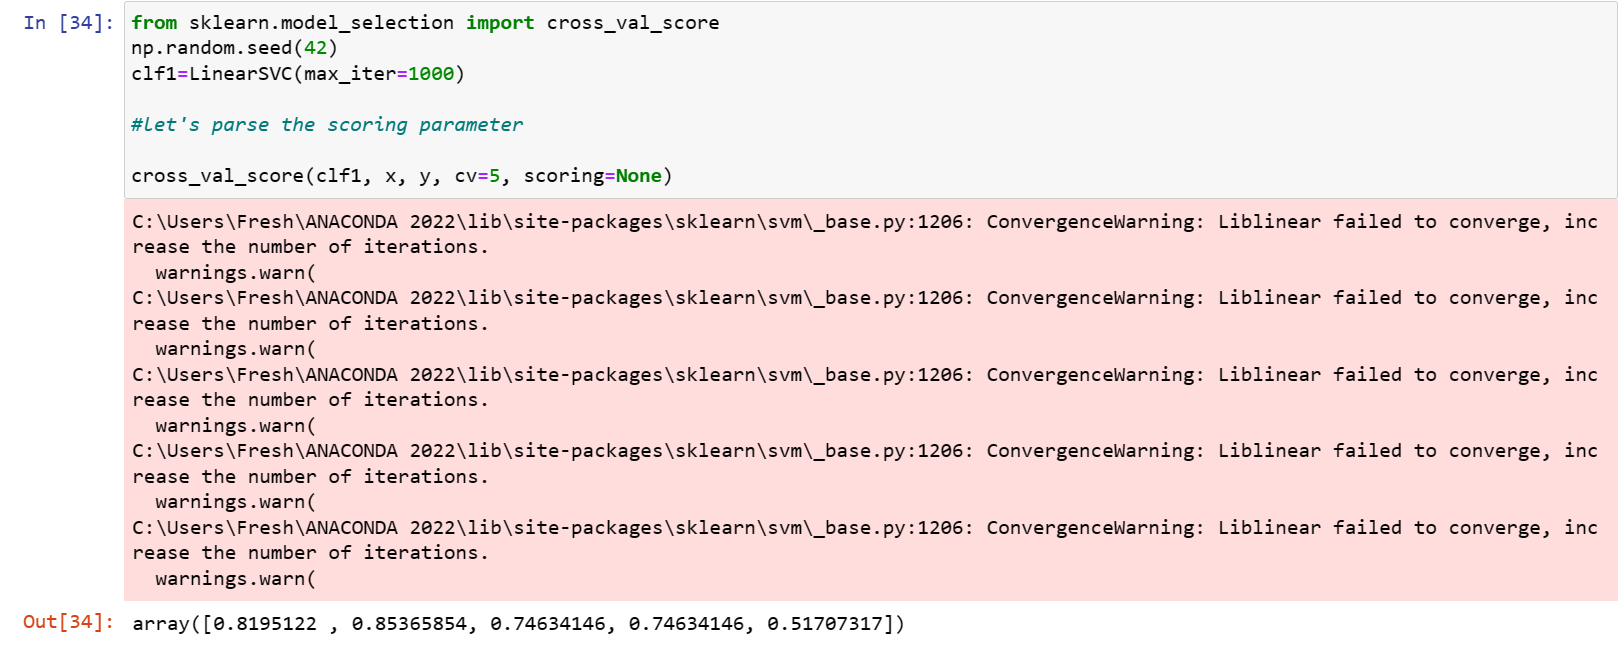
1. Source Parameter- cross_validation
On the LinearSVC:
Evaluating the Linear SVC model
Evaluation Metrics
Score Parameters: 'accuracy', 'average precision', 'recall', 'f1'
Metric functions AUC/ROC score , ' Confusion matrix, Classification report
1. Source Parameter- cross_validation
On the LinearSVC:
 On the RandomForest
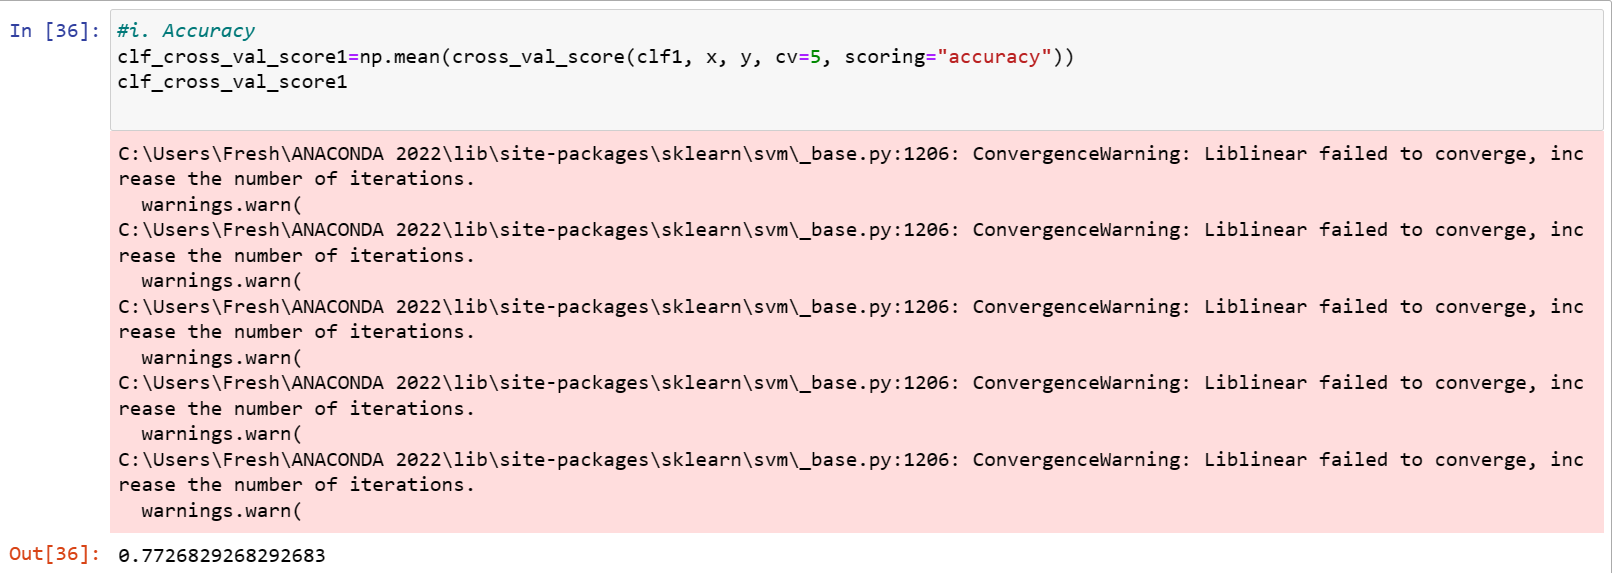
 Accuracy
LinearSVC
Accuracy
LinearSVC
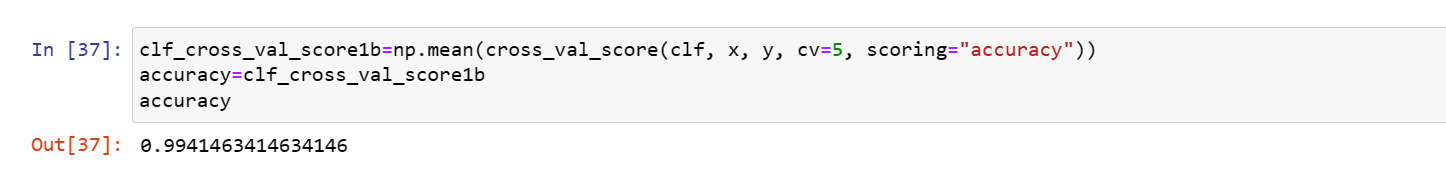
 RandomForest
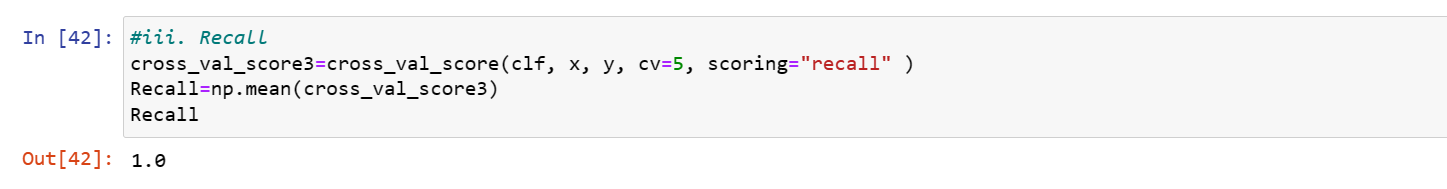
 Recall
LinearSVC
Recall
LinearSVC
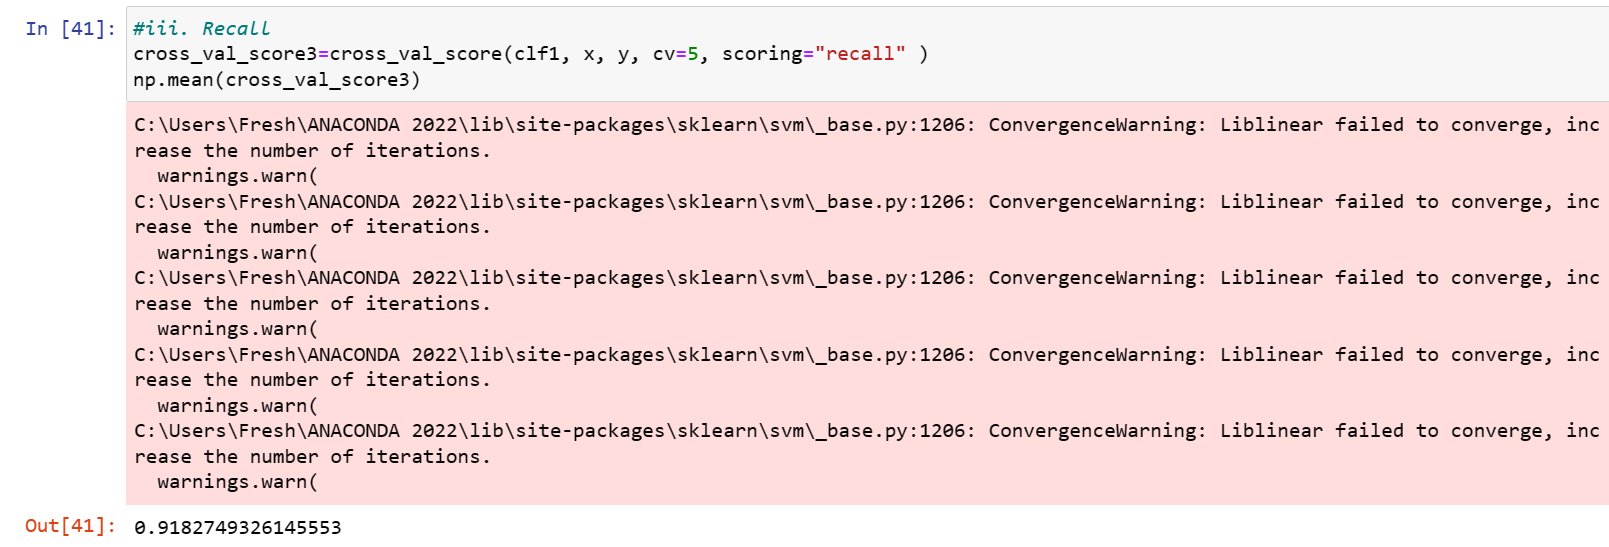 RandomForest
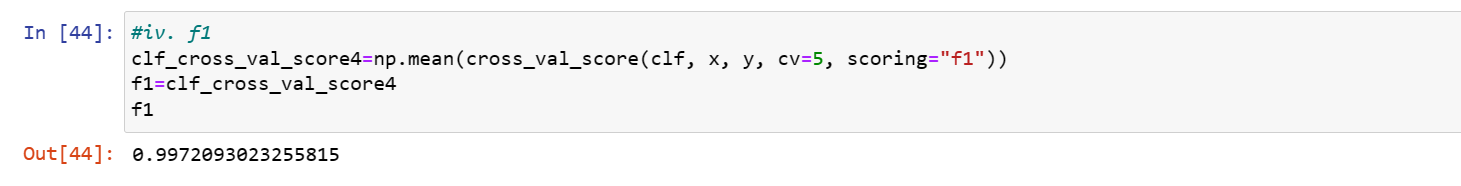
 F1
LinearSVC
F1
LinearSVC
 RandomForest
 From several iterations,the Linear SVC model have about 75% likelihood of predicting the right label i.e about 7 out of 10 times while the RandomForest have over 90% likelihood
Metric Functions
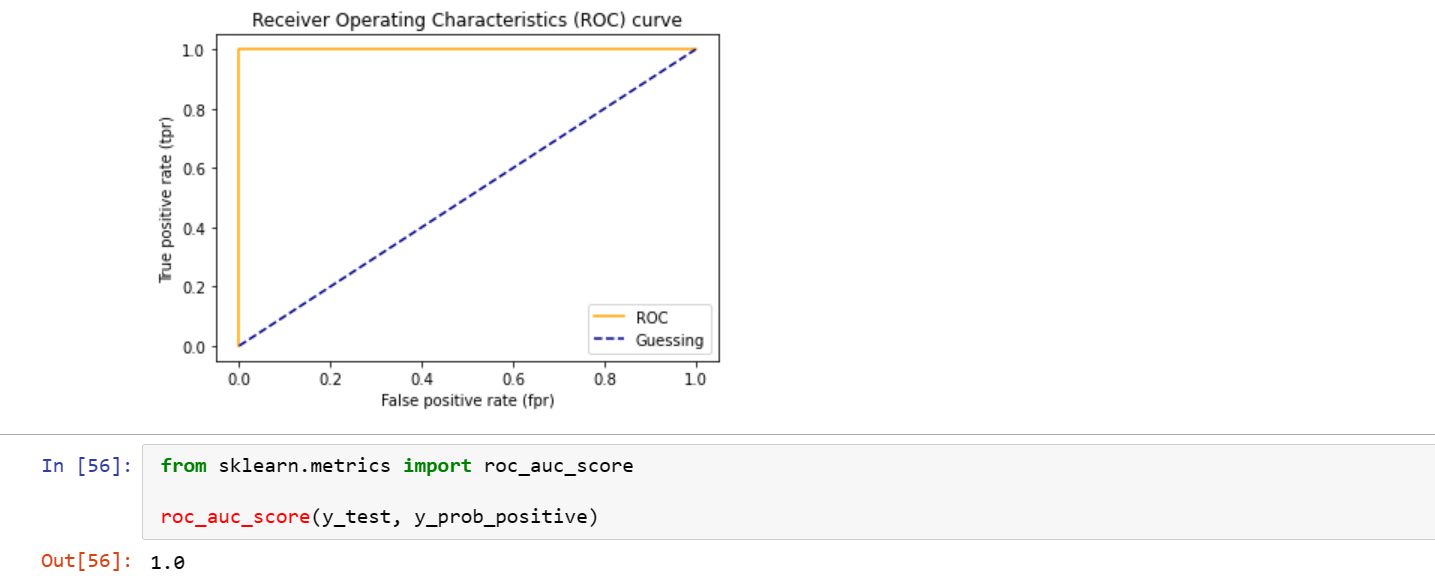
AUC/ROC
comparison of a model true positive rate vs model false positive rate
*True positive= model predicts 1 when truth is 1
*False positive= model predicts 1 when truth is 0
*True negative =model predicts 0 when truth is 0
*False negative =model predicts 0 when truth is 1
Plotting the ROC
From several iterations,the Linear SVC model have about 75% likelihood of predicting the right label i.e about 7 out of 10 times while the RandomForest have over 90% likelihood
Metric Functions
AUC/ROC
comparison of a model true positive rate vs model false positive rate
*True positive= model predicts 1 when truth is 1
*False positive= model predicts 1 when truth is 0
*True negative =model predicts 0 when truth is 0
*False negative =model predicts 0 when truth is 1
Plotting the ROC
 Confusion Matrix
The confusion matrix will help to compare the labels a model predicts and the actual labels it was meant to predict. It reveals where the model is getting confused.
Confusion Matrix
The confusion matrix will help to compare the labels a model predicts and the actual labels it was meant to predict. It reveals where the model is getting confused.
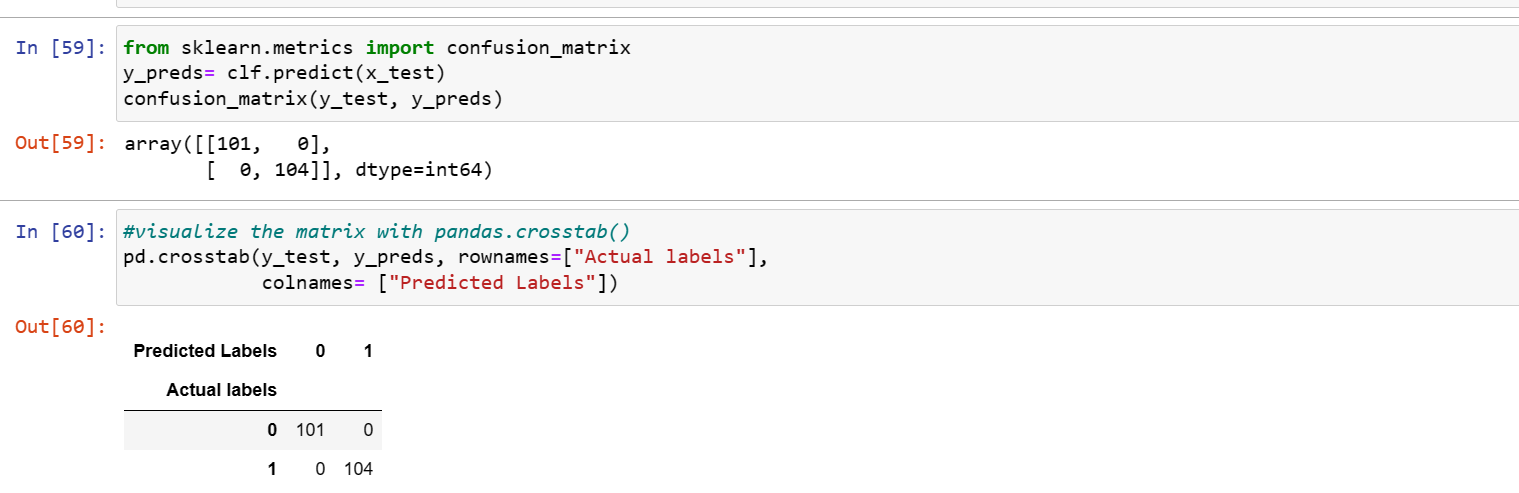 Making the confusion matrix more visual using the Heat Map